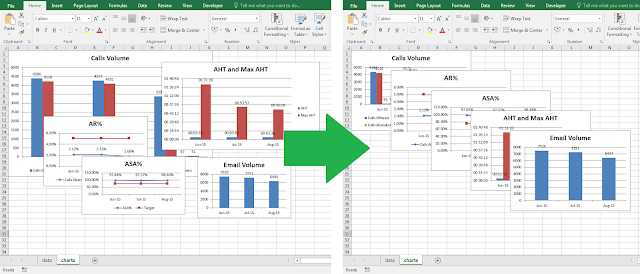
In this post we learn how to resize all charts in the active Excel worksheet at once using VBA macros. The macro also places each chart in a particular position relative to the previous chart, starting from the top left corner of the worksheet. The size of the charts can easily be adjusted changing the values for the Width and Height properties.
Macro code:
Sub
ResizeAllCharts()
Dim oChart As ChartObject
Dim ChartTop As Integer, ChartLeft As Integer
If ActiveSheet.ChartObjects.Count > 0 Then
ChartTop = 0: ChartLeft = 0
For Each oChart In ActiveSheet.ChartObjects
With oChart
.Height = 200
.Width = 300
.Top = ChartTop
.Left = ChartLeft
ChartLeft = ChartLeft + .Width /
3
ChartTop = ChartTop + .Height /
4
End With
Next
End If
End Sub
Macro explained:
- First we declare an object variable (oChart) as a ChartObject. The ChartObject object represents an embedded chart in a worksheet. We also declare the ChartTop and ChartLeft variables to hold the top and left coordinates for each chart.
- Then we count the number of embedded charts (ChartObject objects) in the active worksheet, and if so, we continue to loop through each chart. But prior to that, we set the top and left variables to zero. The first chart will be placed at the top left corner of the worksheet.
- Now we use a For Each loop to loop through every embedded chart in the active worksheet. With each chart, we set the height and width (200 and 300 points respectively), and the top and left position from the ChartTop and ChartLeft variables.
- For each chart, we update the top and left position by a fourth and a third of the chart’s height and width respectively. That displays the charts in a cascade view, but it can be changed to whatever view is preferred.
This is how we resize all charts at once in Excel using VBA macros.
Other examples:
- How to Split Text Into Columns with Excel VBA macros
- How to Insert Picture From URL with Excel VBA macros
- How to Auto Fill Table Data with Excel VBA macros


No comments:
Post a Comment